China builds offshore wind at USD 49/MWh, the US at USD 141/MWh. Where you build now matters more than what you build
IRENA's Renewable Power Generation Costs in 2025 gives us a cleaner test for offshore wind. Global renewable capacity additions exceeded 690GW in 2025, with solar adding more than 500GW and wind around 160GW. Solar PV held at USD 44/MWh, onshore wind fell to USD 33/MWh, and offshore wind fell to USD 78/MWh. More than 90% of new utility-scale renewable capacity undercut the lowest-cost new fossil-fuel alternative.
We see the same pattern in our diligence work. Investors used to pay for sector growth on its own. They stopped. Now they ask which cost line the project cuts, which grid or buyer problem it solves, and whether the fabricator and installer have delivered this scope before.
Location sets the cost
IRENA's offshore wind spread makes the point sharply. China reached USD 49/MWh for offshore wind in 2025. The United States sat at USD 141/MWh. Turbine technology alone cannot explain a gap that size.
IRENA says why: Country-level macroeconomic conditions explain about 56% of the variation in financing costs. Technology explains 24%. Where a project is built now matters more than what is built.
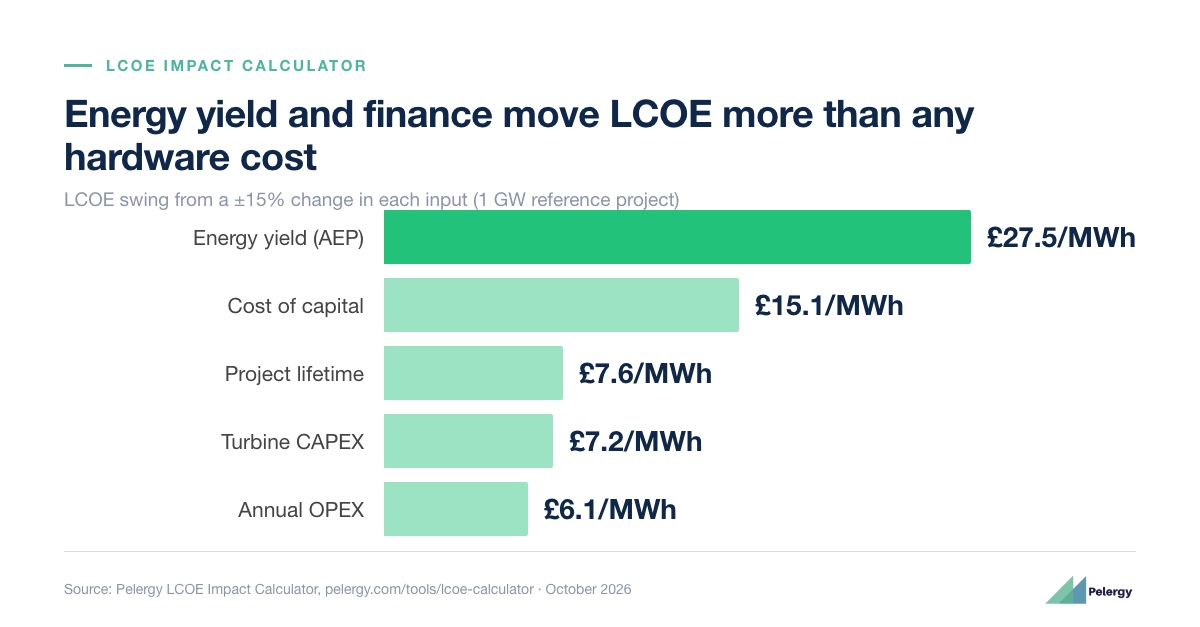
That changes how an offshore wind business case should be read. A project can have a strong turbine platform, a sound wind resource, and a credible sponsor, and still carry a cost of capital, a grid connection date, or a supply-chain premium that the headline LCOE never shows. A thin market screen hides those numbers until the investment paper is already committed.
This is where our market-entry work has paid off directly. In Baltic market-entry work for a utility client, we combined market review, geographic screening, site visits and diligence planning. That staged approach helped the client build a 500MW opportunity pipeline by separating markets with genuine scale from individual sites that still needed real diligence time.
Renewables are absorbing fuel-price shocks
IRENA also shows renewables acting as a cost buffer. In 2025, renewable generation avoided an estimated USD 480bn in fossil-fuel costs and 8.4 gigatonnes of carbon dioxide emissions. In Indonesia, Thailand and the Philippines, existing renewables avoided around USD 5.7bn of coal and gas purchases. At the higher fuel prices seen during the March to May 2026 Middle East crisis, the same avoided volumes would have been worth USD 6.5bn.
Offshore wind earns that premium only when the project names its system role: a generation profile that fits the grid it connects to, a port that can service it, or an industrial buyer that needs the power on a schedule.
We have tested this directly. For a floating wind financial-modelling software provider, we reviewed product positioning for due-diligence and cost-review buyers. For a floating platform developer targeting the US East Coast, we mapped a route to market that started with a smaller beachhead demonstration rather than a full-scale claim. In both cases, repeating the LCOE number moved the case less than testing the evidence behind it.
A practical screen for the next investment paper
For investors, developers and technology companies, IRENA's numbers point to a short screen before a project, pilot or acquisition gets senior attention.
| Test | What to ask | Why it matters |
|---|---|---|
| Cost position | What is the project-specific LCOE once finance, grid connection, port and installation costs are added in? | A global average hides the country-level premium IRENA measures. |
| System role | Which grid operator, port or buyer needs this generation profile, and on what schedule? | Cheap power is now common; a named buyer is not. |
| Financeability | Which country-risk or policy assumption is setting the cost of capital? | IRENA's 56% figure shows financing now outweighs technology. |
| Delivery proof | What installation, operations or certification evidence exists already? | Untested claims turn into diligence rework later. |
| Shock absorption | What happens to the case if fuel prices spike the way they did in early 2026? | IRENA's USD 6.5bn figure shows this is measurable, not theoretical. |
Our Wind Energy Technology Database helps with the technology row of that screen: it compares technology type, evidence tier, deployment fit and procurement readiness across the projects we track. The LCOE calculator lets teams test their own cost assumptions before they commit them to an investment paper.
What we're watching next
IRENA flags a harder next phase. Solar PV and onshore wind are maturing technologies now. Four-hour utility-scale battery storage fell close to 30% in 2025, to around USD 140/kWh. Clean-technology manufacturing investment more than halved between 2023 and the end of 2025.
For offshore wind, "costs keep falling" is no longer an argument on its own. Some turbine platforms will keep improving. Some regions, on IRENA's own numbers, will stay structurally cheaper to build in. Some markets will carry a premium because their grid queue, permitting timeline or supply chain makes delivery slower.
We read that as a mandate to test each project on its own terms rather than borrow the sector average. If you are pulling together the next investment paper and want a second read on the LCOE, the named buyer, or the delivery record behind it, our Wind Energy Technology Database and LCOE calculator are built for exactly that test.
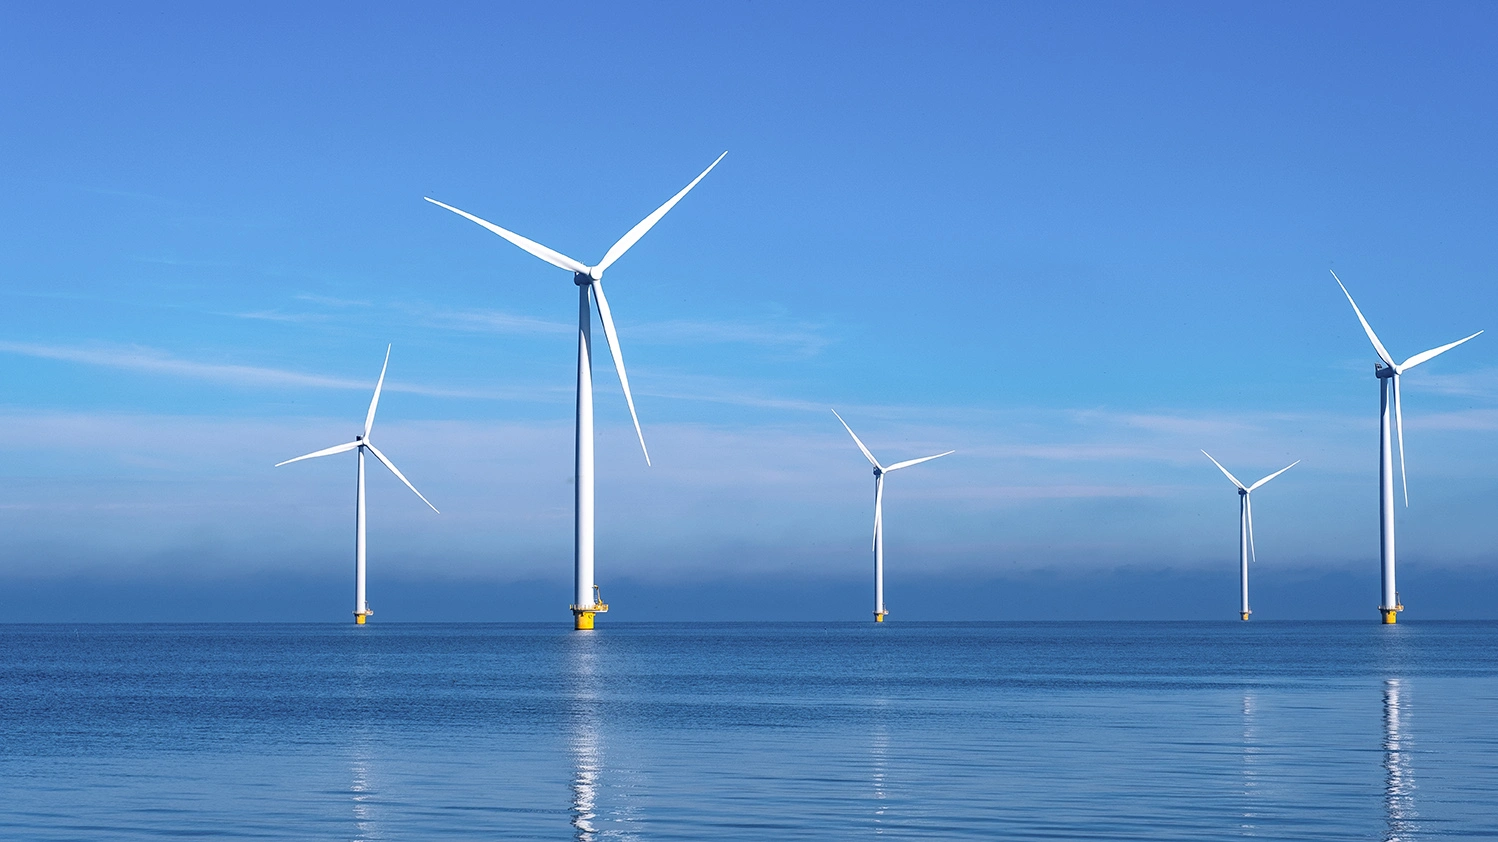
Image credit: RenewableUK. Source: RenewableUK.