LCOE impact of offshore wind technology
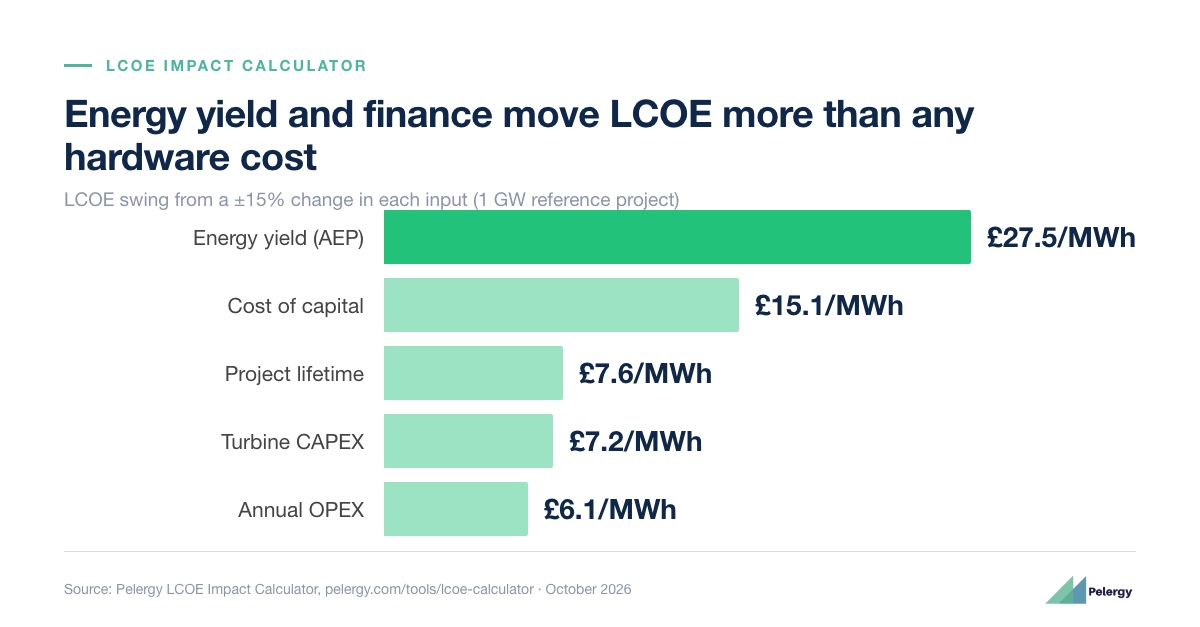
The LCOE impact of offshore wind technology becomes useful when a model identifies the assumption that changes, the evidence supporting that change and the project conditions where it applies.
Levelised cost of energy, or LCOE, is the average cost per unit of electricity generated over a wind project's lifetime. It accounts for upfront capital, operating costs, energy yield and cost of capital. A technology claim needs a route from a technical change to a project input, then from that input to an investment or procurement decision.
Pelergy has tested LCOE-linked claims in investment proposals, financial modelling and commercialisation work. Pelergy used marine operations modelling to validate LCOE reduction claims for a crane-less turbine installation technology aimed at turbines above 20MW. Pelergy has also supported offshore wind financial modelling and cable optimisation software providers with their buyer proposition.
How one LCOE impact of offshore wind technology enters the model
Consider an installation method that reduces the number of vessel days needed to install a turbine or cable system. The technology claim enters the model as a change in installation duration, not as an assumed LCOE saving.
The installation duration affects several project assumptions:
- CAPEX phasing: Fewer vessel days may change when installation expenditure occurs. Earlier or later expenditure changes financing costs.
- Installation cost: The model needs the vessel day rate, mobilisation cost, weather downtime allowance and contingency treatment.
- Project schedule: A shorter installation programme may affect the date when the project starts generating electricity.
- Energy yield: Delays during installation can defer revenue. A technology that reduces schedule risk may therefore change the period over which the asset generates.
- Operating costs: The installation method may create different inspection, repair or access requirements over the operating life.
- Availability: A design or installation change may affect turbine or cable availability. The model needs evidence before it changes the assumed energy output.
- Cost of capital: Lenders and investors may assess construction risk differently where the technology changes the delivery plan. Pelergy would only change this input where evidence supports a different financing assumption.
A technology team should define one primary input first. For an installation method, that might be vessel days per installed unit. For cable optimisation software, it might be cable length, route complexity or installation duration.
Validation questions before relying on the result
The table below provides a compact record for an investment committee, developer or technology buyer.
| Claim | Model input | Evidence to check | Decision consequence |
|---|---|---|---|
| The technology reduces installation time | Vessel days, installation window and weather allowance | Method statement, trial data, vessel assumptions and comparable project conditions | Tests whether lower marine costs and earlier generation are supported |
| The technology reduces capital cost | Equipment cost, vessel cost, mobilisation and contingency | Supplier quotations, scope comparison and cost breakdown | Shows whether the saving sits with the technology provider, contractor or project owner |
| The technology improves availability | Mean capacity rating, or MCR, and availability assumptions | Failure data, maintenance records, warranty terms and independent technical review | Tests whether higher energy output has a credible basis |
| The technology reduces operating cost | Inspection frequency, repair duration and OPEX escalation | Maintenance plan, labour assumptions and access strategy | Identifies whether the effect persists through the operating life |
| The technology reduces project risk | Construction contingency and cost of capital | Contract structure, delivery evidence and financing feedback | Tests whether risk reduction changes finance assumptions or remains a delivery benefit |
Evidence matching the claim's scale is the gate. A component trial may support a performance assumption for that component. It does not automatically support a project-wide change in availability, contingency or financing cost.
Sensitivity analysis identifies where the claim matters
A technology may have different LCOE effects across projects. Vessel-day savings may matter more where vessel availability is constrained. A cable-routing change may carry greater value in deeper water, longer export routes or sites with complex seabed conditions.
Sensitivity analysis tests these conditions without presenting a single scenario as universal. Pelergy's LCOE Impact Calculator includes sensitivity analysis alongside CAPEX phasing, OPEX escalation and MCR modelling. The result can show whether the technology remains valuable when vessel rates, installation duration, availability or financing assumptions change.
Technology SMEs need to identify the project conditions where their claim has the strongest evidence. Investors need to distinguish a technical advantage from a modelled commercial outcome. Developers and operators need to test whether the technology improves the economics of their own project configuration.
Pelergy's LCOE Impact Calculator takes cost, performance and availability characteristics for an offshore wind technology and models their effect on project LCOE. The calculator is free to use in the browser. The subscriber tier includes an editable model, scenario comparison and a Pelergy-reviewed report.
Use the Pelergy LCOE Impact Calculator to turn one technology claim into an evidence-backed project scenario.
Image credit: Pelergy LCOE Impact Calculator. Source: Pelergy LCOE Impact Calculator.